Performance Results
We are proud of our results, showing as they do that our pupils achieve highly despite a turbulent population. Our staff's dedication to ensuring that the curriculum is exciting, engaging and challenge (combined with your child's resilience to learning and motivation to succeed) ensures that every child makes exceptional progress - no matter their starting place.
If you would like to talk to us more about our curriculum and how we support your child, please contact us.
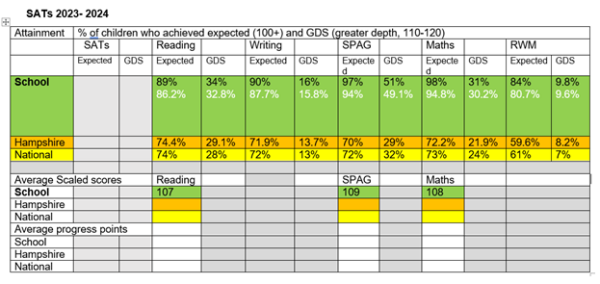
Year 6 Attainment– SATS 2023-24

Service Premium
Reading:
Expected+: 51%
GDS: 42%
Writing:
Expected+: 78%
GDS: 11%
Maths:
Expected+: 65%
GDS: 31%
RWM:
Expected+: 82%
GDS: 5%
Disadvantaged pupils
Reading EXP:
Talavera: 79%
National: 62%
Reading GDS:
Talavera: 17%
National: 18%
Writing EXP:
Talavera: 82%
National: 58%
Writing GDS:
Talavera: 5%
National: 6%
Maths EXP:
Talavera: 87%
National: 59%
Maths GDS:
Talavera: 17%
National: 13%
RWM EXP:
Talavera: 58%
National: 45%
RWM GDS:
Talavera: 4.5%
National: 3%
Link for the DfE performance table and school comparison site; this link will take you directly to the Talavera Junior School page.
http://www.education.gov.uk/cgi-bin/schools/performance/school.pl?urn=116149
If you would like your child to try some practice SATs papers, please follow the link below.
